Some plants can survive colder winter temperatures than others.
Zone of cold hardiness refers to the plant’s ability to survive the winter. It plays a key factor in selecting landscape plants for the region. USDA has classified the entire United States into 13 plant hardiness zones based on their average, annual minimum temperature during 30 year period. Zones with lower number indicate colder climate and the higher number indicate a warmer climate. Each hardiness zones differ by 10 degree F and are further divided in to two sub zones that differ by 5 degree F. The colder half of the sub zone is indicated by the letter ‘a’ and the warmer half indicated by the letter ‘b’.
Click on maps to zoom in
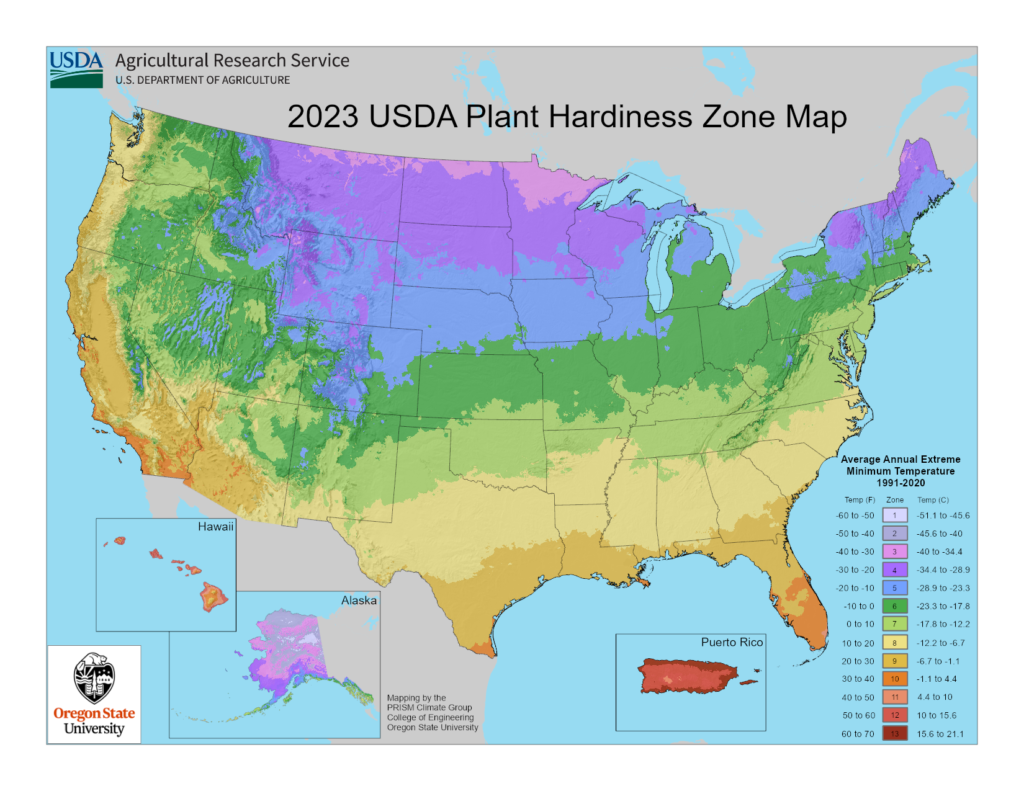
How the 2023 Cold Hardiness Map was developed
The U.S. Department of Agriculture (USDA) released a new plant cold hardiness zone map on Nov. 15, 2023. The new map was jointly produced by the USDA Agricultural Research Service (ARS) and the Oregon State University PRISM Climate Group. This map is based on the annual, average, winter temperature. It is not the coldest temperature reached in winter, but rather is an average based on 30 years-worth of data. Like the previous 2012 cold hardiness zone map, this 2023 map has more accurate, detailed information as the number of weather stations that supplied data increased by 68% over the data collected for the 2012 map. The map is commonly used by the Green Industry and gardeners for selecting cold-hardy plants for their area. The hardiness zone rating is often available in nursery and garden center catalogs or online for each plant sold.
What are hardiness zones based on?
Similar to previous cold hardiness zone maps, the 2023 map is based on range of average, annual, minimum, winter temperature over a 30-year period, not the lowest actual temperature recorded for the area. The zones are divided into 10°F increments. Lower zone numbers are colder climates; higher numbers represent warmer climates. The hardiness zones are further divided into two sub zones of either “a”, the colder part of a hardiness zone, or “b”, the warmer part of a hardiness zone. This means that a zone 5 hardy plant is cold hardy to -10°F to -20°F with further division of this zone into subsections of zone 5a (hardy -15°F to -20°F) or zone 5b (hardy -10°F to -15°F). This subdivision is critical for estimating cold hardiness on woody plants cultivars and species. When in doubt as to whether you are in the “a” or “b” part of a cold hardiness zone, it is better to err on choosing plants that are hardy to the colder “a” zone.
The USDA website of the map now has a section called “Tips for Growers”, which includes a section on how to use the map, plus videos on gardening tips and information about the ARS research programs of potential interest to growers, researchers, and gardeners. Similar to the 2012 map, the 2023 version includes a Geographic Information System (GIS) interactive format that you can use to find your hardiness zone by typing in your zip code.
What changes happened from the 2012 map to the 2023 map?
About half of the U.S. shifted to a half warmer cold hardiness zone, i.e., zone 5a to zone 5b, with the rest remaining in the same half zone, or for Alaska, a few warmer zones were added. The map accounts for more factors such as elevation changes, topography type, temperature inversions and proximity to bodies of water.
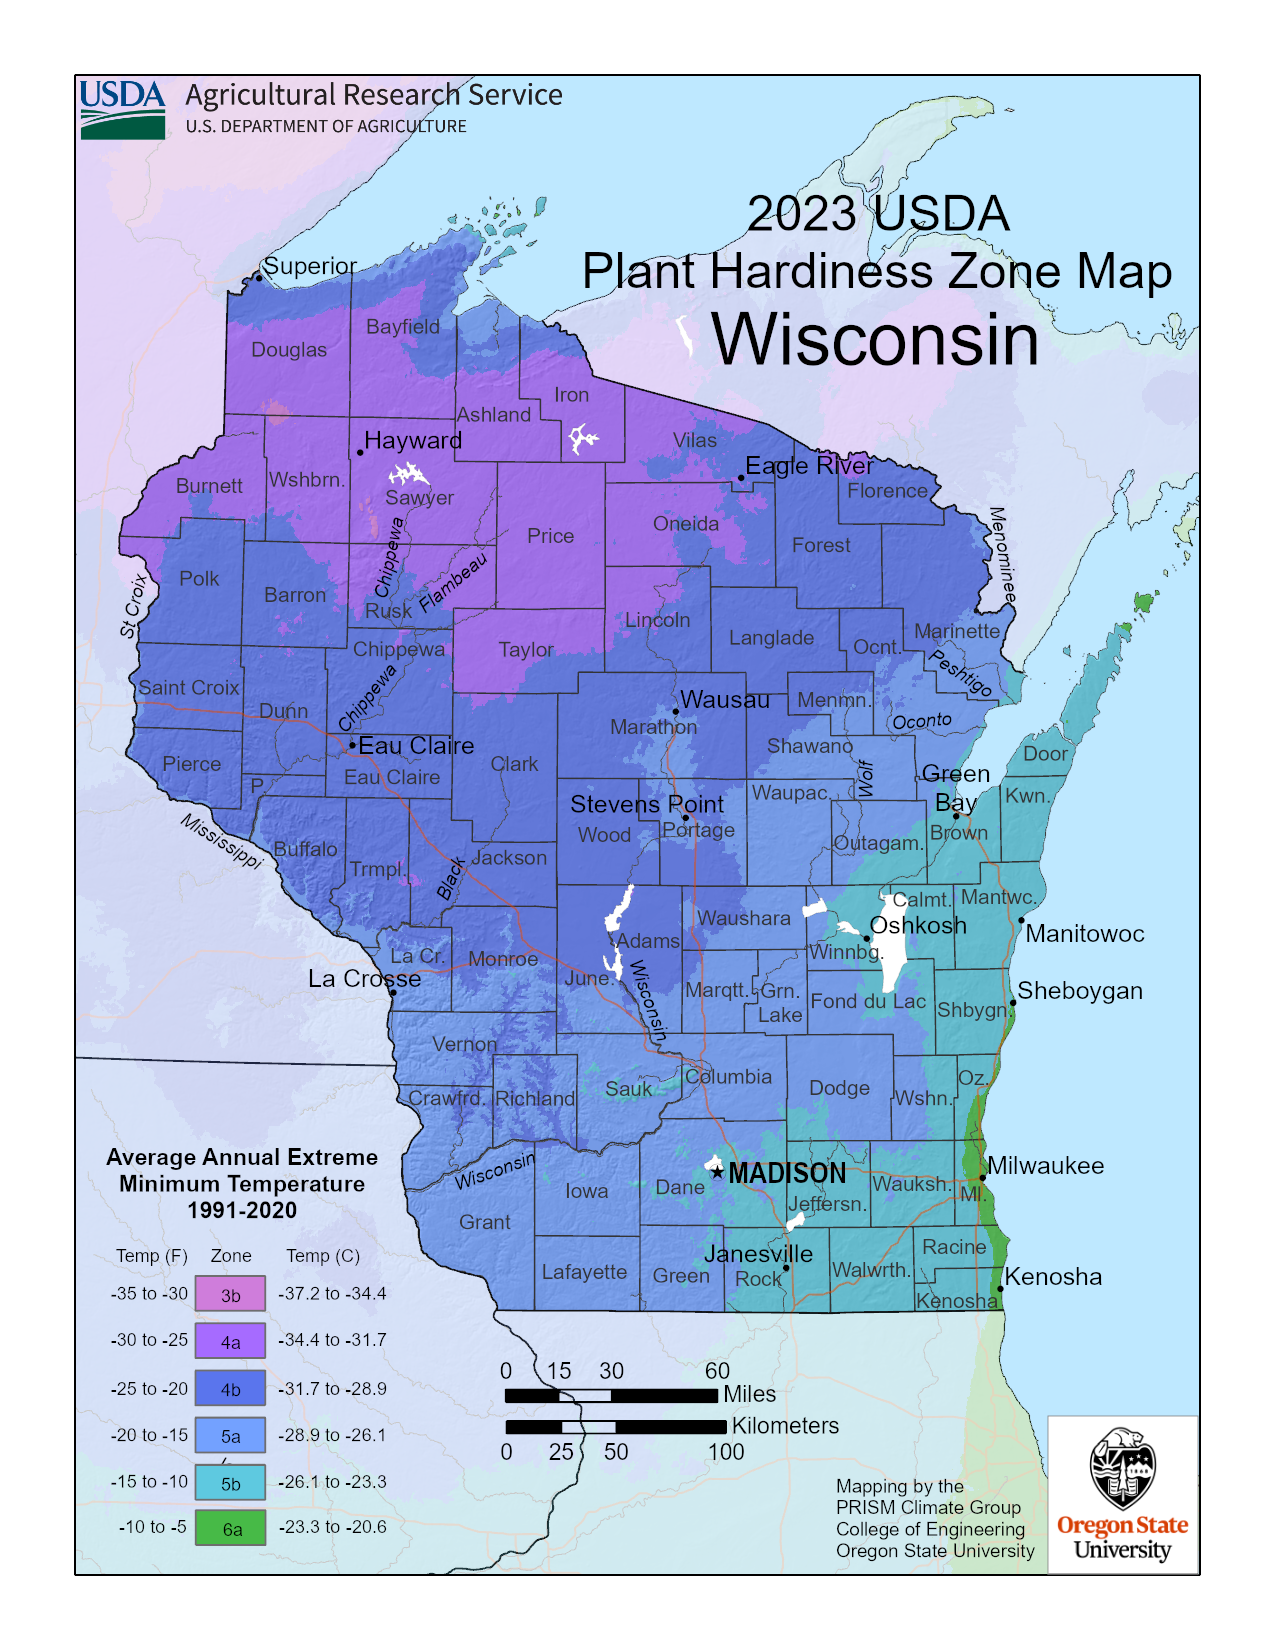
Wisconsin now has four cold hardiness zones (zones 3-6, 2023 map), previously it has three main zones (zones 3-5, 1990 and 2012 maps). The 2023 map includes the addition of zone 6a (-5°F to -10°F) along the western shore of Lake Michigan from Chicago area and Kenosha County up into southeastern Sheboygan County and includes Washington Island off Door County. Hardiness zone 5b (-10°F to -15°F) has expanded westward and includes Madison and areas around Lake Winnebago. Zone 5a (-15°F to -20°F) has moved north of Dane County and is throughout southwestern Wisconsin. Zone 4b (-20°F to -25°F) and zone 4a (-25°F to -30°F) have both shifted northwestern and includes most of northern Wisconsin. The biggest surprise is zone 3b (-30°F to -35°F) has almost disappeared in Wisconsin with only a few small areas in southern Douglas and northern Washburn Counties and Sawyer County by Hayward.
Climate warming possibly accounts for the 30-year average temperatures changes, however, more weather stations from state and federal agencies were used for the 2023 map compared to the 2012 map, thus provided greater data accuracy.
What is hardiness and dormancy?
Most woody and herbaceous perennials gradually acquire greater cold hardiness starting in the fall as daylength and temperatures decrease. A cold-hardy plant can survive the coldest winters due to acclimation or hardening off. A plant “hardens” off for winter and the process must be complete before experiencing extreme cold temperatures.
Woody plants achieve their greatest cold tolerance when they are fully dormant (called endodormancy) in December and January. During deep dormancy, plants will not break bud, even if temperatures are warmer, because the buds have not received enough chilling hours (average of 6-8 weeks below 40°F, with some requiring even colder temperatures for longer durations). During February, plants start to come out of deep dormancy. During the months of March and April, plants enter a stage of eco-dormancy or quiescence, an inactive or resting state, until favorable conditions occur to support bud break and leaf development. During the last stage, the natural plant hormone, abscisic acid (ABA), levels are greatly reduced, while gibberellic acid (GA) levels slowly increase.
However, many other environmental factors are involved in a plant’s “hardiness” besides its cold temperature tolerance. Wind and sun exposure, photoperiod, heat tolerance in the summer months (especially at night), soil texture, structure, drainage, moisture, pH and fertility, annual rainfall and snowfall, humidity, air pollution, pests and diseases, accumulation of carbohydrate reserves made during the day, seed provenance, and overly deep planting all contribute to whether a plant lives or dies during the year.
Plants that are drought stressed, especially evergreens and newly planted trees and shrubs, can suffer winter burn and dieback or death during a particularly cold winter. In that case, cold temperatures are not the sole culprit, but rather drought stress has set the plant up for failure. Thus, rainfall and watering in fall is particularly important as it hydrates the plants going into winter with adequate snow helping to insulate the root zones and lower branches.
What causes temperature-related plant injury?
One of the possible reasons we see injury on trees and shrubs after winter, is due to unusual warmer mid- to late-fall temperatures over a longer period, followed by rapid decrease of severely cold temperatures. Plants rely on a gradual decrease in temperatures and reduced daylengths in fall to trigger the onset of dormancy. If the temperatures have delayed a plant from reaching its full dormancy, stems, buds, and cambium can be damaged or killed if the temperatures drop suddenly and severely. The plants have not shut down and prepared for the incoming colder winter temperatures. Drought-stressed plants are more susceptible to winter injury.
A second reason can occur if prolonged, exceptionally warm temperatures occur in midwinter, followed by a rapid and extreme temperature decrease. Dormant flower and vegetative buds, branch and cambial tissue and roots can be damaged or killed as prolonged warmth causes some plants to start to de-acclimate during that week in winter. Unfortunately, these extreme temperature fluctuations in winter are happening more often since 1990. Midwestern apple, grape, cherry, peach, and other fruit crop growers are experiencing winter kill of their crops more often. For a plant that only flowers once per year, flower bud kill results in little, if any fruit production and huge economic losses.
We are already experiencing warmer than usual temperatures in our winters. It may be nice for us, but for plants, overall plant death can occur the following spring. In particular, flower buds on ornamental trees and shrubs occasionally can be a ½-1 full zone less hardy than the vegetative buds on the same plant. How often do we see forsythia flowers absent in early spring or only a few flowers on the bottom part of the plant that were insulated below the snow line? With new hybrids and cultivars of woody plants introduced to the market every year, it is questionable how truly hardy these plants are, especially when the plants were trialed and evaluated in warmer winter areas such as southern Michigan, Oregon, New York, or North Carolina.
Thirdly, many woody plants can survive a night or two of very cold temperatures from Dec.-Jan., but when those extreme temperatures occur in March or April at the end of the dormant season, severe cambium and root injury or death can result, especially if there is no snow cover. Some plants rely more on temperature to break dormancy than photoperiod, especially non-native plants. During warmer-than-usual weeks in early- to mid-March, plants start to break bud and leaf out or even produce flowers. However, temperatures in April all too often can plummet back down into the low teens and 20’s for several weeks.
Lastly, as temperature and daylength increases throughout the winter into spring, plants start to lose their tolerance to extremely cold temperatures. These late spring frosts damage emerging flower and vegetative buds. For example it is common see the flowers of magnolias ruined by late April to early May frosts, resulting in brown to black flowers.
How do I use the new map in making my plant choices?
The hardiness zone map is a general guide for growing and selecting hardy landscape plants. As mentioned above, the data is based on the average, lowest, winter temperature, not “the” lowest temperature recorded that year. In the Midwest, each year can bring severe temperatures that are colder than the stated range for a particular hardiness zone. However, it can work as an advantage as some invasive plant and insect species are killed off or populations greatly reduced during these extreme cold snaps. That being said, with the predicted future milder, winter temperatures, these invasive species will continue to spread north.
Does the new map mean we can start growing crape myrtles and camellias in Wisconsin? The answer is no, but proper plant selection is due to more than just the extreme temperature tolerance in winter. The hardiness zone map does not consider how many times the temperatures dropped that low, how long those extreme cold temperatures lasted or when the event occurred during the dormant season. As mentioned above, many woody plants can survive a night or two of very cold temperatures from Dec.-Jan., but when those extreme temperatures dip in March or April at the end of the dormant season, severe cambium and root injury or death can result, especially if there is no snow cover. The new 2023 map does not take these events into account and these wild swings in temperature are happening more often since 1990 and especially since 2000.
What about microclimates that are warmer than the designated cold hardiness zone? Microclimates can occur within a landscape that “boost” the survival of marginally hardy landscape plants. For example, sheltered courtyards, landscape beds against buildings or underneath trees, or near bodies of water can help insulate a plant so they are more likely to survive the extreme temperatures of winter. Urban areas are warmer than rural areas due to the heat island effect created by light reflection off buildings and streets, heat rising from sewers and blacktop or concrete parking lots and trapping of heat between large buildings. In contrast, trees planted in open parking lot islands or along streets in sidewalk cutouts are particularly cold and heat stressed and seldom live more than 10 years as they run out of root space or are so drought stressed, they die. In contrast, cooler frost pockets can occur by a low-land valley or low spot in the yard where cold air pools first.
Conclusion
The hardiness zones do not serve to forecast current and future plant performance. Wisconsin winter temperatures and nighttime temperatures during the growing season are rising faster than daytime and summer temperatures. Drier summers are predicted as we have seen this past summer with months of no measurable precipitation. Extreme weather events are predicted to strongly impact the native ranges of North American native trees and shrubs negatively. We also cannot predict a plant’s survival and growth without considering the combination of all landscape conditions in addition to cold temperature tolerance.
Use the 2023 hardiness zone map as a guideline for planting, but use caution when growing or using plants rated as a half cold hardiness zone warmer than what your area normally is in winter. Try a few new species in small numbers to see how they do, but don’t go overboard. Lastly, plants do not read books and unfortunately, plant labels often overestimate the appropriate cold hardiness zone, especially if the woody plants come from large, out-of-state nurseries or big box stores that sell plants all over the U.S. Buyer beware and buy from a local source you can trust!
Author: Laura Jull, Woody Ornamental Horticulture Extension Specialist, Associate Professor, UW-Madison Department of Plant and Agroecosystem Sciences
Revised: November 2024
References
- Avent, T. 2022. History of plant hardiness zone maps: The rest of the story. Plant Delights Nursery, Inc., blog https://www.plantdelights.com/blogs/articles/plant-hardiness-zone-maps
- Raulston, J.C. and K.E. Tripp. 1994. Exploring the complexities of plant hardiness. Arnoldia 54(3):22-31.
- U.S.D.A. Agriculture Research Service (ARS) 1990. USDA plant hardiness zone map. https://planthardiness.ars.usda.gov
- U.S.D.A. Agriculture Research Service (ARS) 2012. USDA plant hardiness zone map. https://planthardiness.ars.usda.gov
- U.S.D.A. Agriculture Research Service (ARS) 2023. USDA plant hardiness zone map. https://planthardiness.ars.usda.gov/
- Widrlechner, M.P., C. Daly, M. Keller, and K. Kaplan. 2012. Horticultural applications of a newly revised USDA Plant Hardiness Zone Map. HortTechnology 22(1): 6-19.